Posts

Showing posts with the label FX/Commo

FX Article: You do not have to go through hell trying to figure this business out

Image
Credit- Forex Factory http://www.forexfactory.com/showthread.php?t=39514&page=2 --------------------------------------------------------------------------------------------------------------------- They say that 95 percent of traders lose and give up. For new traders, that trade anything less than 4 hour charts, its almost 100 percent. They lose everything within a year, and most of the time much sooner. Any new trader that wants to treat this like a business, and take future success seriously, should do the following as a minimum: 1. Whatever/however you trade, it should be done on daily charts or higher, and certainly not under 4-hour 2. To start it should be a demo account. It should stay a demo account until you show a profit three months in a row 3. After demoing open a small practice account with pocket change. You do this also for a minimum of three profitable months in a row 4. You open a normal account and never trade more than 1 to 2 p...

The Best Times to Trade Forex Currency Pairs

Image
Credits: Thx to Nial Fuller http://www.learntotradethemarket.com/forex-trading-strategies/the-best-times-to-trade-forex-currency-pairs ------------------------------------------------------------------------------------------------------------- Note: If you have not done so already please read part 1 first: The Best Currency Pairs to Trade In the first part of this article we discussed which currency pairs are the best to trade and explained the differences between the majors, crosses, and exotics. Today’s article is going to pick up where last week’s left off; we are going to discuss the best times to trade the forex market and the differences between the various FX trading sessions. Since you have read part 1 and you now know which currency pairs to focus on and why, it is important that you understand when the different forex trading sessions are, how they differ from each other, and the best times and days to trade. It is true that the forex market is open 2...

สิ่งที่ Part Time FxTrader พึงกระทำ

Image
ใช้เวลาแต่ละวันหลังเลิกงานให้คุ้มค่า เช็คปฏิทินว่าวันนั้นมีตัวเลขอะไรสำคัญประกาศหรือไม่ เช็ค TF ใหญ่ก่อนทุกครั้ง และอย่าเทรดสวนเทรน ถ้าตลาดวิ่งไปแล้ว ให้หาจังหวะพักตัวแล้วค่อยเข้า บันทึกข้อมูลการเทรด บันทึก Case Study บันทึกข้อผิดพลาด ทำตามระบบ ไม่ฝืนระบบทำตามใจตนเอง อาจจะเริ่มต้นด้วยเงินก้อนเล็ก แต่ให้เน้นที่กระทำตามระบบ เดี๋ยวกำไรมันจะมาเอง คิดเหมือนว่าพอร์ต 1ล้าน USD จดสิ่งที่เรียนรู้ได้ในแต่ละวัน/บันทึกหัวข้อที่อ่านในแต่ละวัน สรุปผลงานประจำสัปดาห์/เดือน เตรียมแผนสำหรับการเทรดสัปดาห์ถัดไป

2011.10.27 Trading Notes

Image
Possible working FX hour 20:30-23:30 and may late night ( 00:15-01:00 ) Monitoring Initial balance $100 2% risk L Profit 23.30 Short 1.4117 Cut Loss on Sky line Loss -1 Use 5m Fibonacci when trading in 1m ถึงแม้ว่าระบบ Trend Following จะเทพเพียงใด แต่ก็ง่อยกระรอกใน Sideway Market อยู่ให้นิ่งแล้วหาจังหวะเข้ารอบใหม่จะดีกว่า วิธีแก้ไข - เล่นรอบ??? Tighten stop??? ..... ... .. . 00:50    50 Pips ที่หายไป อัพไว้ให้เจ็บใจเล่น เลิกเล่นเร็วไปนิด ถ้าติดตามซะหน่อย ก็อร่อยแล้ว :( สิ่งที่สำคัญ ถ้าโดน Shake out แล้ว ต้อง Follow Through ด้วย และปราศจาก Bias ว่าจะไปในทิศทางเดิมที่เราคิดไว้ตอนแรก  ให้มองด้วยใจที่เป็นกลาง ว่า มันจะขึ้นหรือลงก็ได้ ไม่มีใครรู้ มีแต่กราฟเท่านั้นที่เป็นตัวบ่ง

2011.10.27 Trading Notes

Image
ระบบจะใช้ไม่ได้ในช่วง Sideway******** เทรดได้ในช่วงเวลา 19:30-22:30   (14:30-17:00 ยุโรป) เชื่่อกราฟ  อาจจะ นับ 3 แท่งเทียน เพื่อยืนยันสัญญาณก็ได้ (เข้า หลังจากระบบสั่งซื้อ 3 แท่ง) อ่าน Cloud จบแล้ว ค้นคว้าระบบต่อไป ต่อไปก็ CCI RSIOMA แล้วก็ Optimize ระบบ ศึกษาเรื่อง Fx, EA ต่อ Spike ของ CCI ใช้บอกการกลับตัวได้

แนวคิดเกี่ยวกับระบบเทรด Forex ของผม [iCloud] และรายละเอียดอินดี้แต่ละตัว

Image
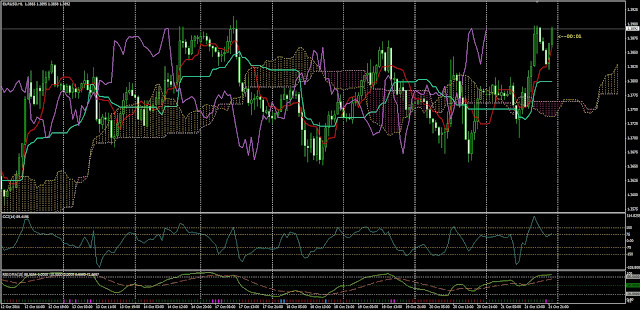
ระบบเทรดของผม (ชื่อว่า iCloud ตั้งตามอินดี้ตัวหลักที่ใช้+ตามที่พี่หมอ mprandy ตั้งให้) ระบบแรกที่สร้างขึ้นมาเองนั้น ประกอบไปด้วยอินดี้ต่างๆ ดังนี้ EURUSD 1h 1.Ichimoku Kinko Hyo     7,22,44 (ปรับจาก 9 26 54) 2.CCI14 3.RSIOMA 10,17 4.Candle Time ใช้นับเวลาการเลื่อนแท่งเทียนอันต่อไป แนวคิดก็เหมือนกับการที่นักบินขับเครื่องบิน(แท่งเทียน) แล้วต้องบินผ่านก้อนเมฆ (Senkou Span) - สีส้มๆ ชมพูๆ ในภาพ ในระดับความสูงต่างๆ ในแต่ละ Timeframe  ก้อนเมฆมี 2 สี คือสีส้ม(กระทิง) กับสีชมพู(หมี) โดยจะเป็นตัวบอกแนวโน้มของเทรนข้างหน้า ถ้าบินมุดเข้าก้อนเมฆ แสดงว่ากำลังจะเลือกไต่ระดับความสูงขึ้นหรือลง  ถ้าไต่พ้นจากก้อนเมฆออกไปข้างบน แสดงว่าให้ L  ถ้าบินทะลุลงมาด้านล่าง แสดงว่าให้ S  โดยหลังเปิดสัญญาไปแล้วทางใดทางหนึ่ง อินดี้ก้อนเมฆตัวนี้จะมีเส้นคัทลอสมาให้เราแล้วในตัว คือเส้น Kijun Sen (เส้นโดดร่ม-สีเขียวๆ) ถ้าหลุดเส้นนี้ ให้ปิดสัญญาทิ้งทันที (ส่วนใหญ่จะปิดได้ก่อนมุดเข้าก้อนเมฆอันต่อไป จะได้กำไรมากกว่าไปขายทิ้งตอนมุดเข้าก้อนเมฆต่อไป) เส้นแดงคือ Tenkan Sen (Fa...

Week 1 : EURUSD & GOLD

Image
เริ่มจากภาพใหญ่ ไปภาพเล็ก EURUSD Month  Triangle เส้นสีแดง เป็นเส้นในระยะ Month ตั้งแต่ปี 2005 จนถึงปัจจุบัน ได้มีการเกิด False Breakout ออกไปในช่วงเดือนพฤษภา ปี2010 จากนั้นก็ได้ Breakthrough เส้น Upper Line ออกไปได้ในช่วงสิ้นปี 2010 -ต้นปี 2011 กำลังสร้างฐานนอกสามเหลี่ยมอยู่ ถ้าไม่หลุดเส้น Red Upper Line ลงไปก็โอเค Week มาต่อในกราฟวีค (เส้นสีฟ้า) เกิด  Triangle เช่นเดียวกัน ก็ได้ทำการ Breakout เส้น Cyan Upper Line ออกไปได้ค่อนข้างจะหายห่วงแล้ว คงไม่มีการกลับตัวลงมาตัดเส้นนี้ในเร็วๆ วันนี้แต่อย่างใด Day กราฟรายวัน เส้น  Triangle สีส้ม กำลังทำท่าจะ Breakout ลงมาทางเส้น Lower Line จึงอาจมีการปรับตัวลงของ EURUSD ในช่วงสัปดาห์นี้ ส่วนตัวผมมองไว้ว่าจะพักตัวที่ Fibo 50% จาก Low เดิม ช่วงวันที่ 11 กพ 54 หรืออาจลงลึกไปกว่านั้น ถึงเส้น Year Upper Triangle ก็เป็นไปได้ GOLD ส่วนทางด้านทองคำ ตกหลุมอากาศมาได้สักช่วงหนึ่ง ทำท่าจะกลับเข้าไปอยู่ใน Upper Trendline อันเดิมได้แล้ว ต้องติดตามดูกันต่อไป..